

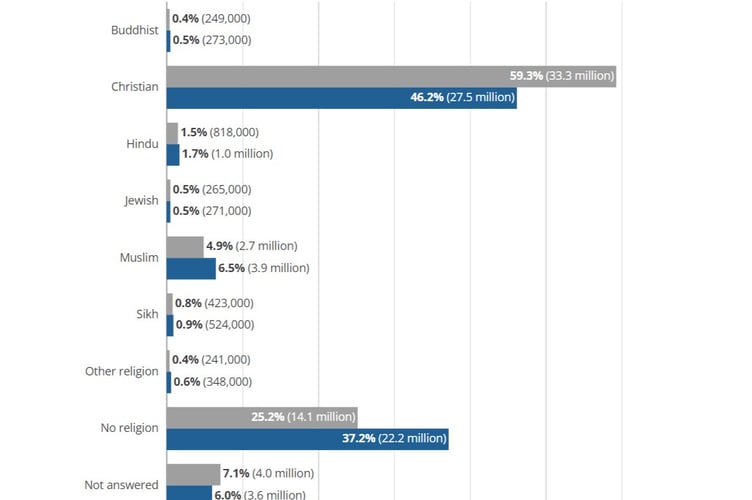
THE latest Census results have been released by the Office of National Statistics (ONS), giving a detailed round-up of religion and identity in Wales that showed Christianity is on the wane in the country.
For the first time in a census of Wales, less than half of the population (43.6 per cent) described themselves as “Christian”, a 14 point percentage point decrease from 57.6 per cent in 2011.
Correspondingly, Wales saw an increase in “No religion” (14.5 percentage point increase, from 32.1 per cent in 2011 to 46.5 per cent in 2021.
In Ceredigion, 43 per cent of people described themselves as having no religion, with 46.7 per cent describing themselves as “Christian”.
.jpeg?width=209&height=140&crop=209:145,smart&quality=75)


The religion question is voluntary, with 7.7 per cent in Ceredigion not answering.
Ceredigion also is home to people who put their religion as “Buddhist”, “Hindu”, “Muslim”, and Jewish.
0.9 per cent of people listed their religion as “other”.
“Christian” was chosen by 46.2 per cent of people in Gwynedd, with “no religion” being selected by 44.2 per cent.
7.3 per cent of people did not answer, while 0.7 per cent selected “other”.
In the region, Christianity was highest in Powys with 48.9 per cent of residents selecting it as their religion, with 42 per cent answering “no religion”.
7.2 per cent of people did not answer, while 0.7 per cent selected “other”.
Interactive map on the religious breakdown of regions in England and Wales
The ONS said: “As the question is voluntary, be cautious when comparing figures between different areas or between censuses because of varying response rates.
“Percentages are calculated out of the overall population as opposed to out of the population who answered the religion question.
“This aids comparison across time and between areas, as the percentage of the population who answer the question varies.
“There are many factors that may be contributing to the changing religious composition of England and Wales, such as differing patterns of ageing, fertility, mortality, and migration.
“Changes may also be caused by differences in the way individuals chose to answer the religion question between censuses.”
Among the 405,000 (0.7 per cent of the overall population in England and Wales) who chose to write-in a response through the "Any other religion" option were Pagan; Alevi; Jain; Wicca; Ravidassia; Shamanism; Rastafarian; and Zoroastrian.
Shamanism increased tenfold to 8,000 from 650 in 2011, data showed.
The latest Census data released also showed that “White" remained the largest ethnic group in England and Wales; 81.7 per cent (48.7 million) of usual residents identified this way in 2021, but that was a decrease from 86 per cent (48.2 million) in 2011.
In Wales alone, the figure for “white” reached 93.8 per cent, or 2.9m people.
Across mid and north Wales, the figures for white ethnicity were higher than the Wales average, and significantly higher than across England and Wales as a whole.
96.2 per cent of residents in both Ceredigion and Gwynedd listed their ethnic group as “white”, with 1.5 per cent choosing “Asian, Asian British or Asian Welsh” as the next largest group in Ceredigion, and 1.7 per cent marking “Asian, Asian British or Asian Welsh” in Gwynedd.
In Ceredigion, 1.2 per cent selected “mixed or multiple ethnic groups”, with 0.5 per cent choosing each of “Black, Black British, Black Welsh, Caribbean or African” and “other”.
In Gwynedd, 1.1 per cent selected “mixed or multiple ethnic groups”, with 0.5 per cent choosing “other”, and 0.4 per cent selecting “Black, Black British, Black Welsh, Caribbean or African”
In Powys, 97.7 per cent of people selected “White” as their ethnic group, with 0.9 per cent choosing “Asian, Asian British or Asian Welsh”, 0.2 per cent as “Black, Black British, Black Welsh, Caribbean or African”, 0.9 per cent selected “mixed or multiple”; with 0.3 per cent choosing “other”.
The ONS said: “Ethnicity is multi-dimensional and subjective, with various ways in which a person may choose to define their ethnic group.
“This may include common ancestry, elements of culture, identity, religion, language and physical appearance.
“It is generally accepted that ethnic group does include all these aspects, and others, in combination.”
In Wales, "Welsh" remained the first response option for the national identity question, as in 2011. The number of people choosing "British" only as their national identity also rose in Wales from 16.9 per cent (519,000) in 2011 to 18.5 per cent (574,000) in 2021.
This coincided with a decrease in those choosing "Welsh" only to describe their national identity (55.2%, or 1.7 million, which is down from 57.5 per cent, or 1.8 million, in 2011).
Local authority level data for national identity is not yet available.
The latest census results also showed that the percentage of people who spoke English (English or Welsh in Wales) as their main language was higher in Wales (96.7 per cent, 2.9 million out of 3.0 million) than it was in England (90.8 per cent, 49.7 million out of 54.7 million).
In Wales, people were asked if their main language was anything other than English or Welsh. Therefore, it is not possible to determine how many people in Wales consider Welsh to be their main language.
There was a separate question for people in Wales asking them about their Welsh language ability. On 6 December, the Welsh Government will be publishing information on Welsh language skills in Wales.
The census provides estimates of the characteristics of all people and households in England and Wales on Census Day, 21 March 2021.
It is carried out every 10 years and gives us the most accurate estimate of all the people and households in England and Wales.
Comments
This article has no comments yet. Be the first to leave a comment.